Monitoring Dashboard
Automated Monitoring Dashboard
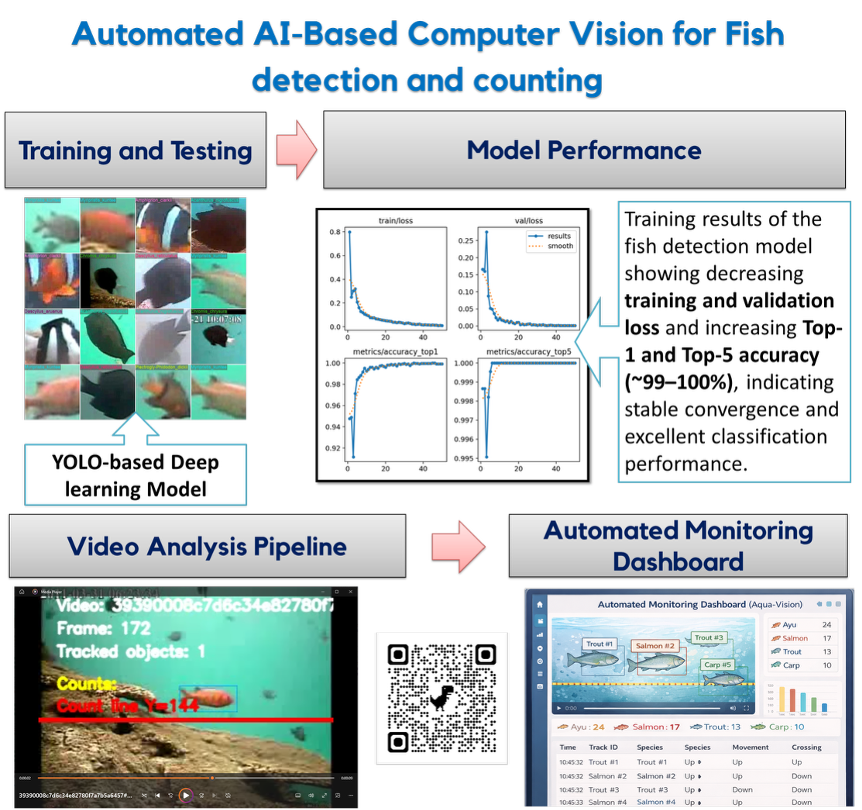
The AquaTRAC AI Monitoring Dashboard serves as the central command-and-control interface, providing a comprehensive and real-time overview of river ecosystem dynamics. Designed for both scientific analysis and operational decision-making, the dashboard integrates live data streams with advanced analytics in a unified platform.
Core Dashboard Components
-
Real-Time Data Overview
Displays key system information including:- Current date and time
- Total detected counts across all monitored locations
- System status and data flow indicators
-
Migration Count Chart
A dynamic, rolling bar chart visualizing daily migration activity, categorized by:- Small, medium, and large size classes
- Temporal trends across monitoring periods
-
Ayu Migration Trend Analysis
A dedicated analytical panel comparing:- Real-time AI-detected counts
- Historical baseline data (2011–2024) provided by Prof. Takemon
This enables validation of AI outputs and identification of long-term ecological trends.
-
Species Distribution Breakdown
A graphical summary (e.g., pie chart or bar chart) illustrating:- Relative abundance of detected species
- Diversity patterns across the monitored system
-
Live Event Feed
A continuously updating stream of recent detection events, including:- Timestamp (e.g., Apr 12, 11:42)
- Species identification (e.g., Salmon #1, Carassius #1)
- Movement status (e.g., Upstream, Downstream, Stationary)
-
Live Camera Feed with AI Overlay
Real-time video visualization enhanced with:- Bounding boxes around detected fish
- Species labels and confidence scores
- Instant visual confirmation of AI predictions
Benefits for Managers
The AquaTRAC AI Dashboard transforms traditional monitoring into a proactive, data-driven management system, enabling more effective and timely decision-making.
Key Advantages
-
Proactive Management and Early Warning
Immediate detection of abnormal events, such as:- Sudden migration surges
- Blockages or inefficiencies in fish passages
- Unusual behavioral patterns
-
Enhanced Scientific Accuracy
Continuous, objective, and high-resolution data replaces intermittent manual observations, improving:- Data reliability
- Ecological interpretation
- Long-term monitoring consistency
-
Optimized Resource Allocation
Data-driven insights allow managers to:- Prioritize intervention areas
- Optimize maintenance and restoration efforts
- Allocate resources efficiently based on real-time needs
System Impact
By integrating real-time analytics with intuitive visualization, the AquaTRAC AI Dashboard enables a shift from reactive monitoring to intelligent ecosystem management, supporting sustainable river governance and biodiversity conservation.